
A New Record High Will Set The Perfect Bull Trap
(Written by Bert Dohmen, contains excerpts from our June 22, 2025 Wellington Letter)
It is puzzling how analysts on TV can be bullish on the market now with all the international havoc and disasters. Remember that stock valuations are near record highs with the indices just a few percentage points from record highs as well.
Anyone buying now must believe that conditions for the stock market are as good or better than at any other prior market high. Does that make sense?
Many investors could easily make the case that conditions now are significantly more risky than even last year. Thus, these highs in valuations and prices have no rational reason. They can’t last.
Our view has been that the next several months will see a churning volatile market. That makes low positions imperative. As you know, we believe that money flows is one of the best indicators for the market. Only a change in money flow, i.e. supply/demand, can change the price.
Over the past 11 weeks money flows have been going out of the market. But the indices have been rising. That’s a sign of “distribution,” when stocks are sold by the big smart money to the emotional retail investors and money managers. That often occurs at the top of market moves.
The churning, up and down, is a sign of this distribution. This process takes time.
You see, in a bear market, someone has to own the stocks all the way down. The naïve investors are designated as the “bagholders.”
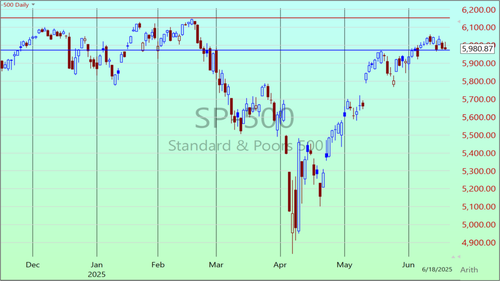
Based on decades of experience, the perfect end of distribution is when a major index makes a new record high. As we mentioned in our last Wellington Letter (June 8 issue), that will probably be the S&P 500 to get most of the attention (upper red horizontal line on chart below). From last Friday’s close that would be about a 3% upmove.
On the daily chart of the S&P 500 below we can see it is now right at support (blue horizontal line), which it should bounce off in the coming days. That bounce will then be used to propel the S&P 500 to a new record high the next weeks. That could be the ultimate trap.
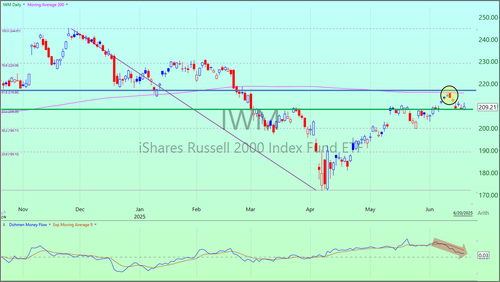
Small cap stocks are a good way to gauge risk appetite within the market. The IWM is the ETF for the small cap Russell 2000 index. On the daily chart below we can see it was rejected by the strong resistance area (blue horizontal line), which coincided with its 200-day m.a. (pink line), on June 11 and then turned lower.
Currently it is sitting at support from the 50% Fibonacci Retracement of the late November 2024-early April 2025 plunge (green horizontal line). The Dohmen Money Flow (bottom, red arrow) is deep into “sell” territory now. However, a brief bounce by the IWM back to upside resistance now would be normal.
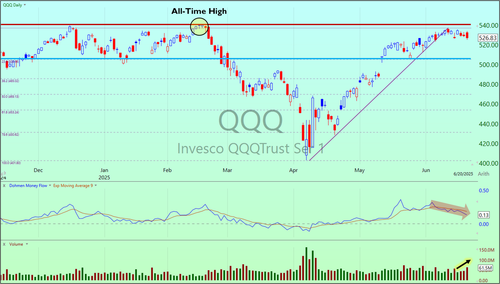
The QQQ, ETF for the tech-heavy NASDAQ 100 Index, got within a fraction of 1% to the old record high recently but failed to get there and has since rolled over. On the daily chart of QQQ below we can see a bearish divergence since early June as the Dohmen Money Flow (bottom, red arrow) was declining during the rise in QQQ. Over the past three trading days volume (bottom, black arrow) has increased while the QQQ has declined, which is another bearish indication for the near-term.
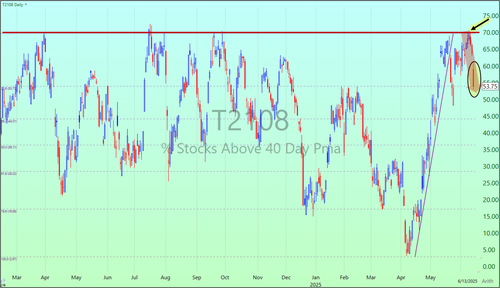
Another chart that has been flashing “caution” signals the past couple of weeks is the “Percent of Stocks Above their 40-day m.a.” (daily chart below). It was rejected by the 70% resistance level (red horizontal line) on three consecutive days from June 9-11.
Notice how over the past 15 months, this level has proven to be very strong resistance each time resulting in a decline in the indicator shortly after (yellow shaded circles).
In our June 11, 2025 Smarter Stock Trader, we warned our members that this chart signifies that “the broader market rally has been exhausted and its “fuel” is nearly empty or has already run out.”
After peaking at 69.8% on June 10, the percent of stocks above their 40-day moving average has now dropped down to just 50% (as of June 20). See the chart below:
After the final phase of distribution, there is often a sudden sharp downward reversal, often marked by large downgaps at the opening. That closes the “bull trap.” One key thing to keep in mind is that the length of the distribution period is usually an indication of the depth of the subsequent decline in the market.
CONCLUSION: We have been seeing signs of exhaustion and “fading buying power” since late May. Those signs have only become more evident over the past few weeks. We are seeing one sector after another becoming victims of big selling by the big, smart money. The new owners of the stocks are the less experienced “bagholders.”
If you enjoy reading our analysis, you can now gain instant access to our latest award-winning Wellington Letter (published June 22, 2025). After becoming a member, you will not only gain instant access to this issue, but also to our most recent issues over the past 2 months.
Wishing you successful investing,
Bert Dohmen, Founder
Dohmen Capital Research
Editor, The Wellington Letter